カギ足についてです。計算式、エクセルVBAコード、チャートを掲載
カギ足は値幅の上昇・下降を1本の線で表したもので、一定の比率の騰落、一定の値幅の騰落にて垂直の線が上へ伸びるか、下に伸びるかを描画します。
通常、非時系列の指標で、時間の経過は関係なくレートの動きのみによって描かれますが、ここではそれを時系列に適用し、チャートの移動とともにカギ足を描画する「時系列カギ足」について掲載します。

時系列カギ足の計算方法、描画方法
一定の値幅は変動率Nを決定。
期間のはじめのレートを基点Xとする。
●(A)基点Xから上昇の場合 基点Xに上昇後のレートを代入⇒Cへ
●(B)基点Xから下降の場合 基点Xに下降後のレートを代入⇒Dへ
C)基点Xから変動率Nを超えて下落した場合、下落後のレートを基点Xとして(A)へ
D)基点Xから変動率Nを超えて上昇した場合、上昇後のレートを基点Xとして(B)へ
以下、上記の繰り返し。
上記で決定される基点Xの値を時間の経過を横軸としたチャートに表示すると、時系列カギ足となり、C、Dの時にのみ横軸のメモリをひとつ進ませ、基点Xを描画すると、カギ足となる。
時系列カギ足のチャート
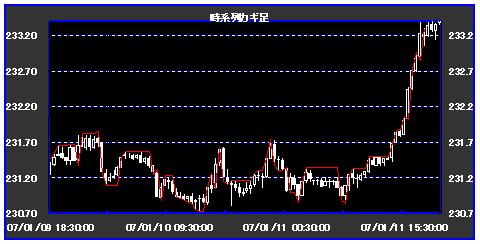
(時系列カギ足:転換値幅0.3)
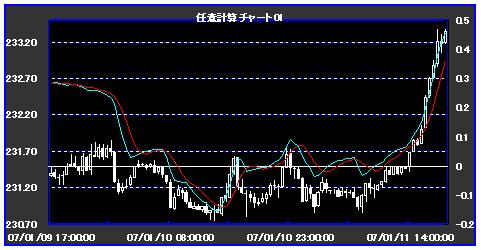
(同MACD化:12-24-5)
時系列カギ足のエクセルVBAコード
‘※ エクセルの1列目(A列)に行番号、2列目(B列)に日時、
‘※ 3列目(C列)~6列目(F列)に始値・高値・安値・終値
‘********************************
‘ tensyu :変動率か変動幅か(1=変動率%、0=変動幅通貨単位)
‘ ten :変動率・変動幅
‘ num:現在の行
‘ cell_h:基点(HIGH)書き込み列
‘ cell_l:基点(LOW)書込み列
‘ cell_t:上昇・下降書き込み列
‘ cell_key:時系列カギ足
‘********************************
high = .Worksheets(s_name)Cells(num, 4)
low = .Worksheets(s_name)Cells(num, 5)
If tensyu = 1 Then
ten = ten / 100
Else
ten = ten
End If
If num > 2 Then
If Cells(num, cell_key) = “” Then Cells(num, cell_key) = Cells(num – 1, cell_key)
If Cells(num, cell_t) = “” Then Cells(num, cell_t) = Cells(num – 1, cell_t)
If Cells(num – 1, cell_t) = “” Then Cells(num, cell_t) = 0
If Cells(num, cell_h) = “” And Cells(num – 1, cell_h) = “” Then
If Cells(num, cell_t) = “” Or Cells(num, cell_t) = 0 Then
Cells(num, cell_h) = high
End If
End If
If Cells(num, cell_l) = “” And Cells(num – 1, cell_l) = “” Then
If Cells(num, cell_t) = “” Or Cells(num, cell_t) = 0 Then
Cells(num, cell_l) = low
End If
End If
If Cells(num, cell_h) = “” And Cells(num – 1, cell_h) <> “” Then
If Cells(num, cell_t) = 0 Or Cells(num, cell_t) = 1 Then
Cells(num, cell_h) = Cells(num – 1, cell_h)
End If
End If
If Cells(num, cell_l) = “” And Cells(num – 1, cell_l) <> “” Then
If Cells(num, cell_t) = 0 Or Cells(num, cell_t) = -1 Then
Cells(num, cell_l) = Cells(num – 1, cell_l)
End If
End If
If Cells(num, cell_h) <> “” Then
pH = Cells(num, cell_h)
If high > pH Then
Cells(num, cell_h) = high
If Cells(num, cell_t) = 1 Then Cells(num, cell_key) = Cells(num, cell_h)
End If
If tensyu = 1 Then
pH_lim = Cells(num, cell_h) – Cells(num, cell_h) * ten
Else
pH_lim = Cells(num, cell_h) – ten
End If
End If
If Cells(num, cell_l) <> “” Then
pl = Cells(num, cell_l)
If low < pl Then
Cells(num, cell_l) = low
If Cells(num, cell_t) = -1 Then Cells(num, cell_key) = Cells(num, cell_l)
End If
If tensyu = 1 Then
pL_lim = Cells(num, cell_l) + Cells(num, cell_l) * ten
Else
pL_lim = Cells(num, cell_l) + ten
End If
End If
If num > 2 Then
If high >= pL_lim Then
If Cells(num, cell_t) = -1 Or Cells(num, cell_t) = 0 Then
Cells(num, cell_h) = high
Cells(num, cell_t) = 1
Cells(num, cell_l) = “”
Cells(num, cell_key) = Cells(num, cell_h)
End If
End If
If low <= pH_lim Then
If Cells(num, cell_t) = 1 Or Cells(num, cell_t) = 0 Then
Cells(num, cell_l) = low
Cells(num, cell_t) = -1
Cells(num, cell_h) = “”
Cells(num, cell_key) = Cells(num, cell_l)
End If
End If
End If
End If
(外部リンク)テクニカル指標(Wikipedia)