RSIについてです。計算式、チャート、エクセルVBAコード
相対力指数と訳されるオシレータ系の指標で、相場の強弱の傾向を測る指標の一つ。
計算方法は過去N本の値上がり平均値、値下がり平均値を基に計算されます。
計算方法、計算式、チャート、エクセルVBAを下記掲載してます。
RSIの計算式(Nは足数)
計算のはじめ
RSI = A / (A+B) × 100
A = 過去N本の値上がり幅平均
B = 過去N本の値下がり幅平均
2本目以降
RSI = A’ / (A’ + B’) × 100
A’ = ( ( N -1 ) × A + 現在の足の値上がり幅 ) / N
B’ = ( ( N -1 ) × B + 現在の足の値下がり幅 ) / N
RSIのチャート
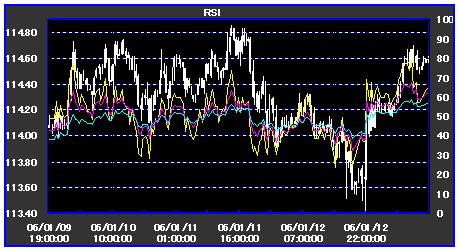
上記チャート、黄色線が9本、赤線が18本、水色線が36本のRSI
RSIのVBAコード
‘※ エクセルの1列目(A列)に行番号、2列目(B列)に日時、
‘※ 3列目(C列)~6列目(F列)に始値・高値・安値・終値
‘********************************
‘ rsi :RSIの採用本数
‘ num:現在の行
‘ cell_rsi:RSI計算値書込み列
‘ cell_sa : 全足比書込み列
‘ cell_up:値上がり幅平均書込み列
‘ cell_do:値下がり幅平均書込み列
‘********************************
If cell(num – 1, 6) <> “” Then Cells(num, cell_sa) = _
Cells(num, 6) – Cells(num – 1, 6)
If cell(num – (rsi – 1), 6) <> “” Then
If Cells(num – 1, cell_rsi) = “” Then
rsi_max = Application.SumIf(Range(Cells(num – (rsi – 1), _
cell_sa), Cells(num_1, cell_sa)), “>0”) / rsi
rsi_min = Abs(Application.SumIf(Range(Cells(num – (rsi – 1), _
cell_sa), Cells(num_1, cell_sa)), “<0”)) / rsi
Cells(num, cell_up) = rsi_max
Cells(num, cell_do) = rsi_min
Cells(num, cell_rsi) = rsi_max / (rsi_max + rsi1_min) * 100
End If
If Cells(num – 1, cell_rsi) <> “” Then
If Cells(num_1, cell_sa) > 0 Then
rsi_max = (Cells(num – 1, cell_up) * (rsi – 1) + _
Cells(num, cell_sa)) / rsi
Else
rsi_max = Cells(num – 1, cell_up) * (rsi1 – 1) / rsi
End If
If Cells(num_1, 114) < 0 Then
rsi_min = (Cells(num – 1, cell_do) * (rsi – 1) – _
Cells(num, cell_sa)) / rsi
Else
rsi_min = Cells(num – 1, cell_do) * (rsi – 1) / rsi
End If
Cells(num, cell_up) = rsi_max
Cells(num, cell_do) = rsi_min
Cells(num, cell_rsi) = rsi_max / (rsi_max + rsi_min) * 100
End If
End If
(外部リンク)テクニカル指標(Wikipedia)