パラボリック・タイム・プライスについて。計算式、チャート、エクセルVBAコード。
トレンド系の指標ですが、連続したラインを描くのではなく、買い方向、売り方向に放物線を描く形で描画される指標です。
計算式、計算方法、加速因子や上限値などパラメータを変更した場合のラインの変化、エクセルVBAコードを掲載しています。
PTPの計算式(Nは足数、PTP=パラボリック・タイム・プライス)
PTP = ( ep – 直前のPTP ) × AF + 前日のPTP
※ep
PTPが買いサインを示している期間の最高値
PTPが売りサインを示している期間の最低値
※AF = 加速因子
( 0.02 ≦ AF ≦ 0.20 )
PTPのチャート
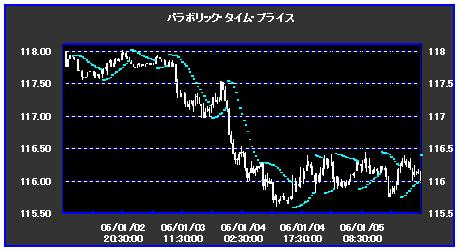
(加速因子:0.02~0.2)
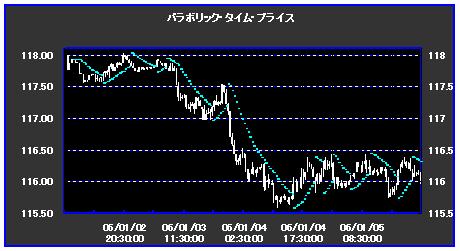
(加速因子:0.05~0.15)
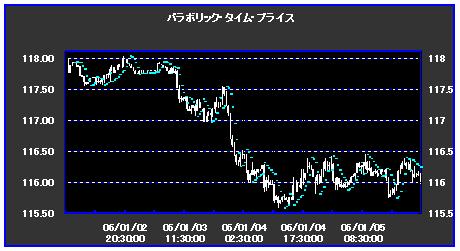
(加速因子:0.1~0.5 通常外)
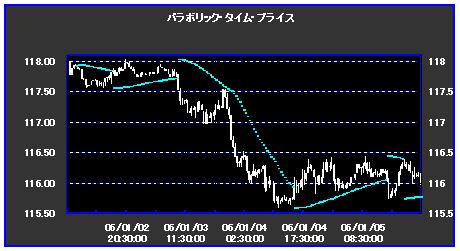
(加速因子:0.005~0.3 通常外)
PTPのエクセルVBAコード
‘※ エクセルの1列目(A列)に行番号、2列目(B列)に日時、
‘※ 3列目(C列)~6列目(F列)に始値・高値・安値・終値
‘********************************
‘ af_min :加速因子AF最小値
‘ af_max :加速因子AF最大値
‘ cell_ptp:PTP計算値書込み列
‘ cell_pos : 方向書込み列
‘ cell_ep:EP書込み列
‘ cell_ptp1:次ロウソク足PTP書込み列
‘ cell_af:現在加速因子書込み列
‘ cell_epmax:EPMAX書込み列
‘ cell_epmin:EPMIN書込み列
‘********************************
If Cells(num – 1, 6) <> “” And Cells(num – 1, cell_pos) = “” _
And Cells(num, cell_pos) = “” Then
Cells(num, cell_af) = af_min
Cells(num, cell_epmax) = af_max
End If
If Cells(num – 1, 6) <> “” And Cells(num – 1, cell_epmax) <> “” _
And Cells(num – 1, cell_epmax) <> “” _
And Cells(num – 1, cell_epmin) = “” _
And Cells(num – 1, cell_ep) = “” Then
Cells(num, cell_pos) = 1
Cells(num, cell_ptp) = Cells(num, 4)
Cells(num, cell_ep) = Cells(num, 4)
Cells(num, cell_af) = Cells(num – 1, cell_af)
Cells(num, cell_ptp1) = (Cells(num, cell_ep) – _
Cells(num, cell_ptp)) * Cells(num, cell_af) + _
Cells(num, cell_ptp)
Cells(num, cell_epmax) = Cells(num – 1, 3)
Cells(num, cell_epmin) = Cells(num – 1, 4)
End If
If Cells(num – 1, 6) <> “” And Cells(num – 1, cell_pos) <> “” Then
If Cells(num – 1, cell_ptp1) > Cells(num, 4) _
And Cells(num – 1, cell_pos) = 1 Then
Cells(num, cell_pos) = 0
Else
If Cells(num – 1, cell_ptp1) < Cells(num, 3) _
And Cells(num – 1, cell_pos) = 0 Then
Cells(num, cell_pos) = 1
Else
Cells(num, cell_pos) = Cells(num – 1, cell_pos)
End If
End If
If Cells(num – 1, cell_pos) = 0 And Cells(num, cell_pos) = 1 Then
Cells(num, cell_ptp) = Cells(num – 1, cell_epmin)
Else
If Cells(num – 1, cell_pos) = 1 And Cells(num, cell_pos) = 0 Then
Cells(num, cell_ptp) = Cells(num – 1, cell_epmax)
Else
Cells(num, cell_ptp) = (Cells(num – 1, cell_ep) – _
Cells(num – 1, cell_ptp)) * _
Cells(num – 1, cell_af) + _
Cells(num – 1, cell_ptp)
End If
End If
If Cells(num – 1, cell_pos) <> Cells(num, cell_pos) Then
Cells(num, cell_epmax) = Cells(num, 3)
Else
If Cells(num – 1, cell_epmax) < Cells(num, 3) Then
Cells(num, cell_epmax) = Cells(num, 3)
Else
Cells(num, cell_epmax) = Cells(num – 1, cell_epmax)
End If
End If
If Cells(num – 1, cell_pos) <> Cells(num, cell_pos) Then
Cells(num, cell_epmin) = Cells(num, 4)
Else
If Cells(num – 1, cell_epmin) > Cells(num, 4) Then
Cells(num, cell_epmin) = Cells(num, 4)
Else
Cells(num, cell_epmin) = Cells(num – 1, cell_epmin)
End If
End If
If Cells(num, cell_pos) = 0 Then
Cells(num, cell_ep) = Cells(num, cell_epmin)
Else
Cells(num, cell_ep) = Cells(num, cell_epmax)
End If
If Cells(num – 1, cell_pos) <> Cells(num, cell_pos) Then
Cells(num, cell_af) = af_min
Else
If Cells(num – 1, cell_af) + af_min <= af_max Then
Cells(num, cell_af) = Cells(num – 1, cell_af)
If Cells(num – 1, cell_pos) = 1 _
And Cells(num – 1, cell_epmax) <> Cells(num, cell_epmax) Then
Cells(num, cell_af) = Cells(num – 1, cell_af) + af_min
End If
If Cells(num – 1, cell_pos) = 0 _
And Cells(num – 1, cell_epmin) <> Cells(num, cell_epmin) Then
Cells(num, cell_af) = Cells(num – 1, cell_af) + af_min
End If
Else
Cells(num, cell_af) = Cells(num – 1, cell_af)
End If
End If
Cells(num, cell_ptp1) = (Cells(num, cell_ep) – Cells(num, cell_ptp)) _
* Cells(num, cell_af) + Cells(num, cell_ptp)
End If
(外部リンク)テクニカル指標(Wikipedia)
ピンバック: パラボリック・タイム・プライス 騙し回避の施策(1) | | IBI-Square
ピンバック: パラボリック・タイム・プライス 騙し回避2 マルチタイムフレーム | IBI-Square